
Power BI Desktop, building reports with the agent
Set up the Power BI operator and let a desktop agent build the report for you.
The Power BI connector reads your published dashboards. The Power BI operator goes further: it drives Power BI Desktop on your own machine, so an agent can open your data, write the measures, and lay out the visuals while you watch. This page walks the whole thing, from install to finished report.
What you need
Three pieces have to be in place before the first run.
- Agento Agent installed on the machine that will do the work. Open its settings and keep the Power BI operator toggled on.
- Power BI Desktop, which is free from the Microsoft Store or as a direct download. It has to be open while the agent works, and a
.pbixfile has to be loaded already. The agent works inside the file you give it, it doesn't create one from nothing. - The Power BI Modeling MCP server, which is how the agent talks to Desktop. The easiest route is to install VS Code, then install the Power BI Modeling MCP extension. The extension drops the executable in a spot the Agento Agent finds on its own, so there's nothing to configure by hand.
Add the node
Open a new workflow, find Power BI in the node list on the left, and drag in Power BI Analyst. It's a Desktop Agent, so it runs on a real machine rather than in the cloud.
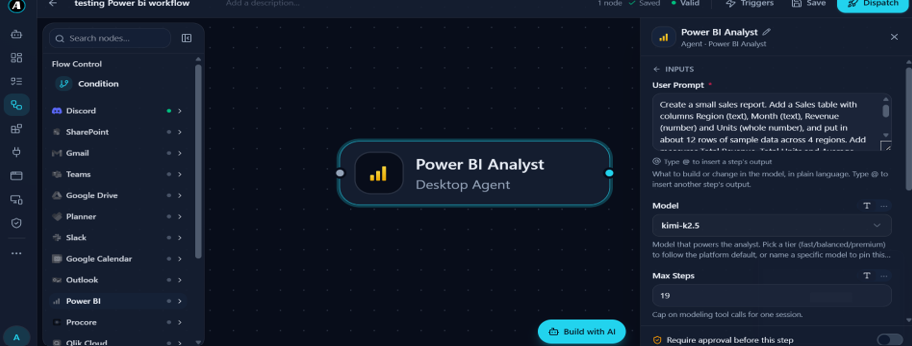
Three settings matter here.
- User Prompt is what you want built or changed, in plain language. Type
@to pull in the output of an earlier step. - Model picks the brain.
kimi-k2.5is a good default for modeling work. - Max Steps caps the modeling tool calls in one session. Keep it low for a quick job and raise it for a big one. Something around 19 handles a small report comfortably.
There's also Require approval before this step. Leave it on. The agent is about to take control of an app on your desktop and you'll want the pause.
Point it at a folder and a machine
Scroll down the same panel for the last two fields.
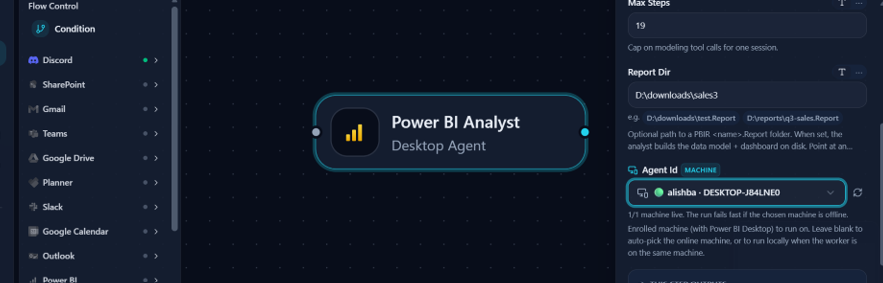
- Report Dir is an optional path to a PBIR
<name>.Reportfolder, likeD:\downloads\sales3. Set it and the analyst builds the data model and the dashboard on disk rather than only in memory. - Agent Id is the machine that runs the job. Pick the one with Power BI Desktop open. Leaving it blank auto-picks whichever machine is online, which is fine when you only have one, but naming it explicitly saves confusion later. Watch the live count next to the field, a run against an offline machine fails fast.
Write the prompt
The agent is only as good as the brief. Tell it where the data lives and what you want out of it, then let it choose the visuals. A prompt that works:
Read the file at D:\Downloads\hrfinance.xlsx.

Inspect it first: identify the file type, then list the sheets, columns,
data types and the values that actually matter.

Then build the analysis I asked for and pick the right chart for it:
  bar for comparisons
  line for trends over time
  pie for proportions
  scatter for relationships between variables

Give every visual a clear title, labelled axes, a legend and units.
Use only the data in the file. Do not invent, adjust or assume values.
Two habits worth keeping. Always give the complete file path, not a folder or a filename on its own. And always say "use only the data in the file", because it is the line that keeps a model from filling a gap with something plausible.
If you'd rather not write the brief yourself, Build with AI at the bottom of the canvas drafts the workflow for you and you edit from there.
Run it and approve
- Hit Dispatch, then watch the Run progress panel on the right.
- Click Approve & continue when it asks. Until you do, the step sits at pending and nothing touches your desktop.
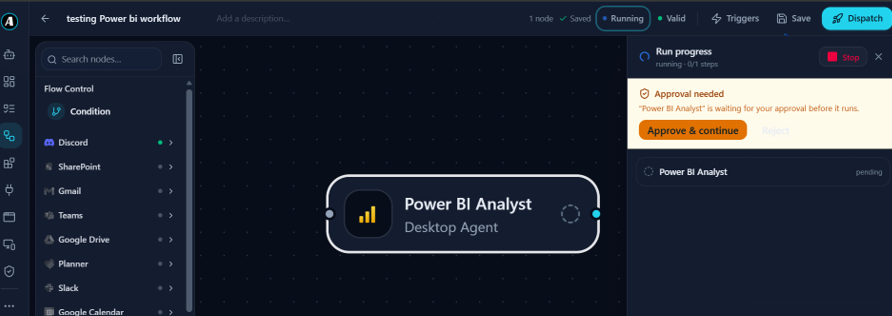
- Leave it alone while it works. Simple jobs finish in seconds. A real analysis usually takes three to ten minutes, and you'll see Power BI Desktop moving on its own while it does.
See the result
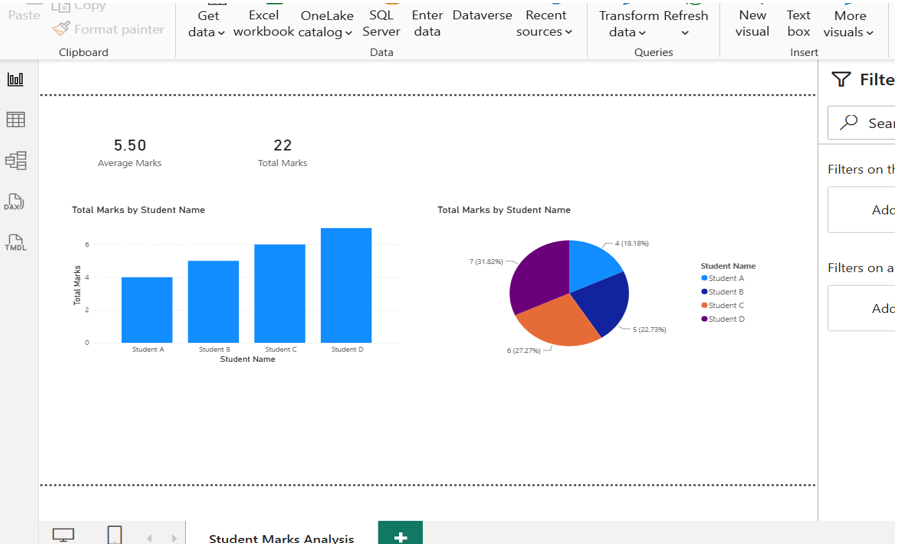
Switch to Power BI Desktop when the run finishes. You'll probably see blanks and a warning that some tables have incomplete data, which is normal, Desktop just hasn't reloaded yet. Click Refresh now.
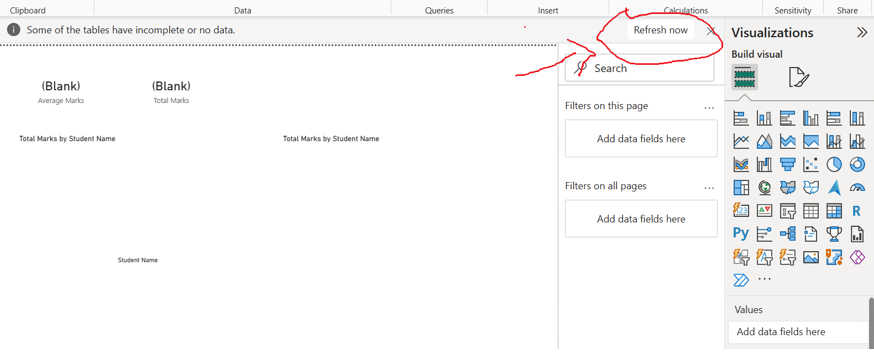
Now the measures and visuals are there, on the page, in the file you already had.
Good to know
- Power BI Desktop has to stay open and unlocked for the whole run. If the machine sleeps or the file closes, the run stops where it was.
- The agent edits the
.pbixthat's currently loaded. Work on a copy the first few times, until you trust what it does. - No approval, no actions. Desktop runs pause for you, and a run left waiting will simply sit there rather than pressing on.
- If the run fails saying it can't reach Power BI, the MCP server is usually the cause. Reinstall the VS Code extension, then restart the Agento Agent so it rediscovers the executable.
- For dashboards that are already published, you don't need any of this. The Power BI connector reads them from the service with nothing installed locally.